 Rehome B.V.Product, SEO and PaidOngoing engagement
How we grew Rehome 193% in 6 months
Rehome came to us with a website they were not happy with and a price calculator that gave the wrong number. We rebuilt both, then added SEO and Meta ads. Six months later revenue is up 193%, a lead costs €14.54, and every euro of ad spend brings back about ten.
- 193%
- revenue growth
- €14.54
- cost per lead
- ~10x
- return on ad spend
- 1,320
- organic clicks
in 6 months
Meta, all campaigns
at a ~€150 average job
first 3 months of search
Rehome B.V. moves furniture and household goods across the Netherlands. House moves, single item transport, IKEA runs, junk removal. They came to us unhappy with their previous developer, and it was easy to see why.
The website did not look like a company you would trust with everything you own. And the price calculator, which is the only part of the site that actually makes money, was hard to use, gave the wrong price often enough to hurt, and was close to unusable on a phone.
We worked in order: fix the site, then fix the product, then bring people to it, then pay to bring more. Skipping to the last step is the common mistake. Ads pointed at a broken calculator just buy you more people who leave.
Step 1. A site that looks like the company
Moving is a trust purchase. You are handing strangers your furniture and hoping it arrives. The old site was not broken, it was just unconvincing, and that is a harder problem because nothing on it looks like a bug.
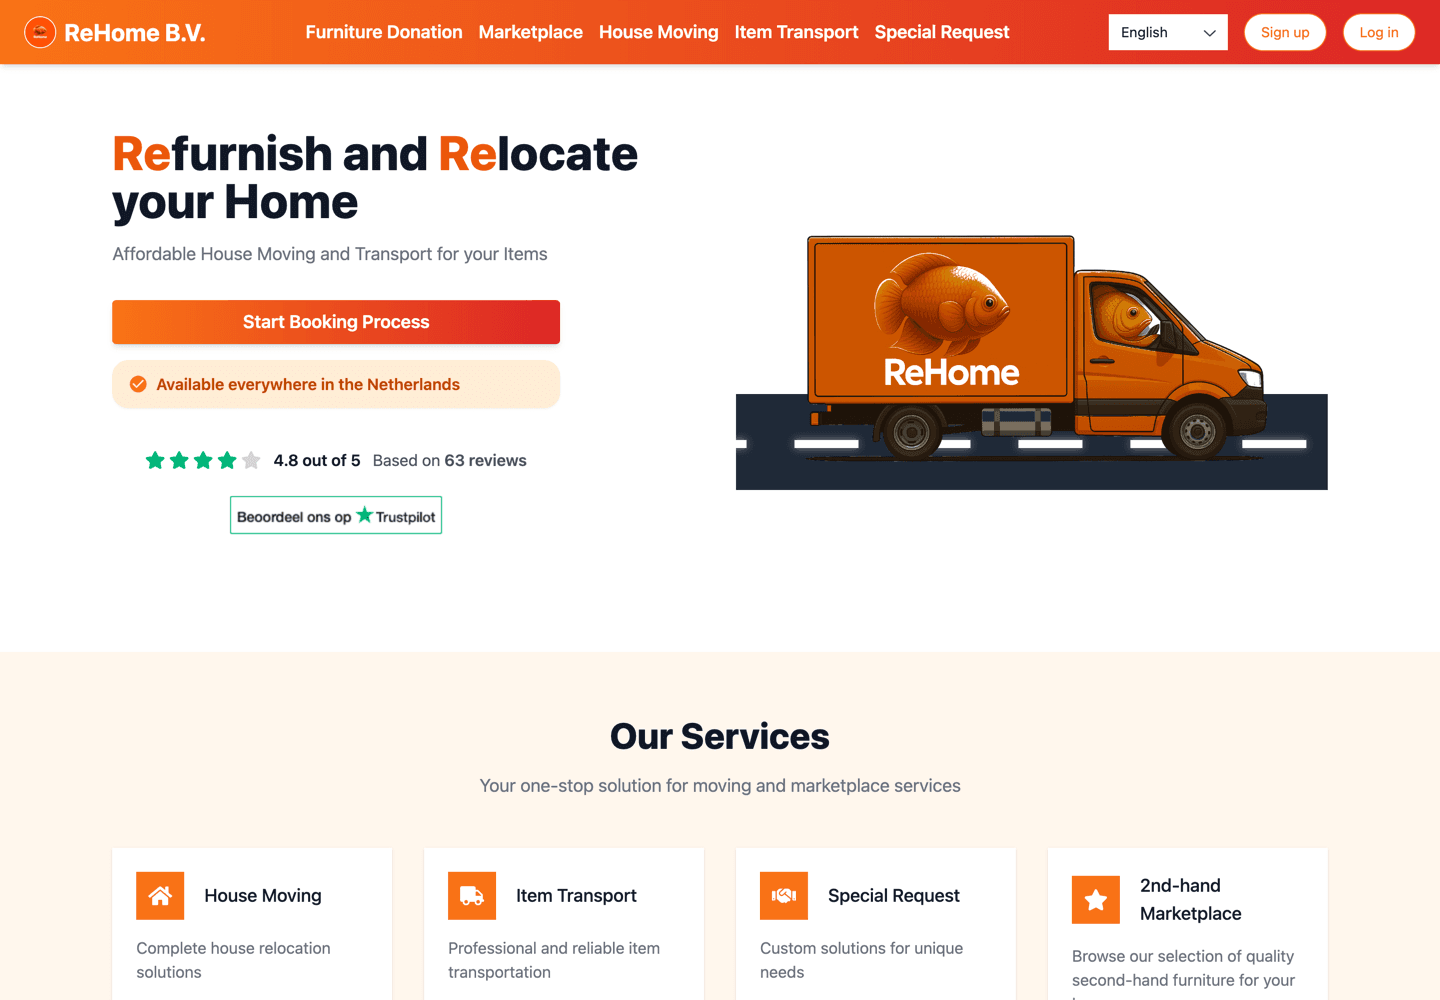
So the redesign had one job: make a visitor believe these people do this properly. Real photos of their own crew instead of stock images of nobody. Customer reviews at the top rather than buried on a review site. One obvious next step. And built for a phone first, because that is where most of their visitors are.

Step 2. Rebuild the calculator
For Rehome the calculator is the product. Someone enters where they are moving from and to, picks their items, and sees a price. Everything else on the site exists to get them to that form.
Which is why a wrong price is not a small bug. Too low and they lose money on the job or have to call the customer back and change it, which costs them the customer and the review. Too high and they never hear from that person again. Both outcomes are invisible in an analytics dashboard, so the problem had been running for a long time.
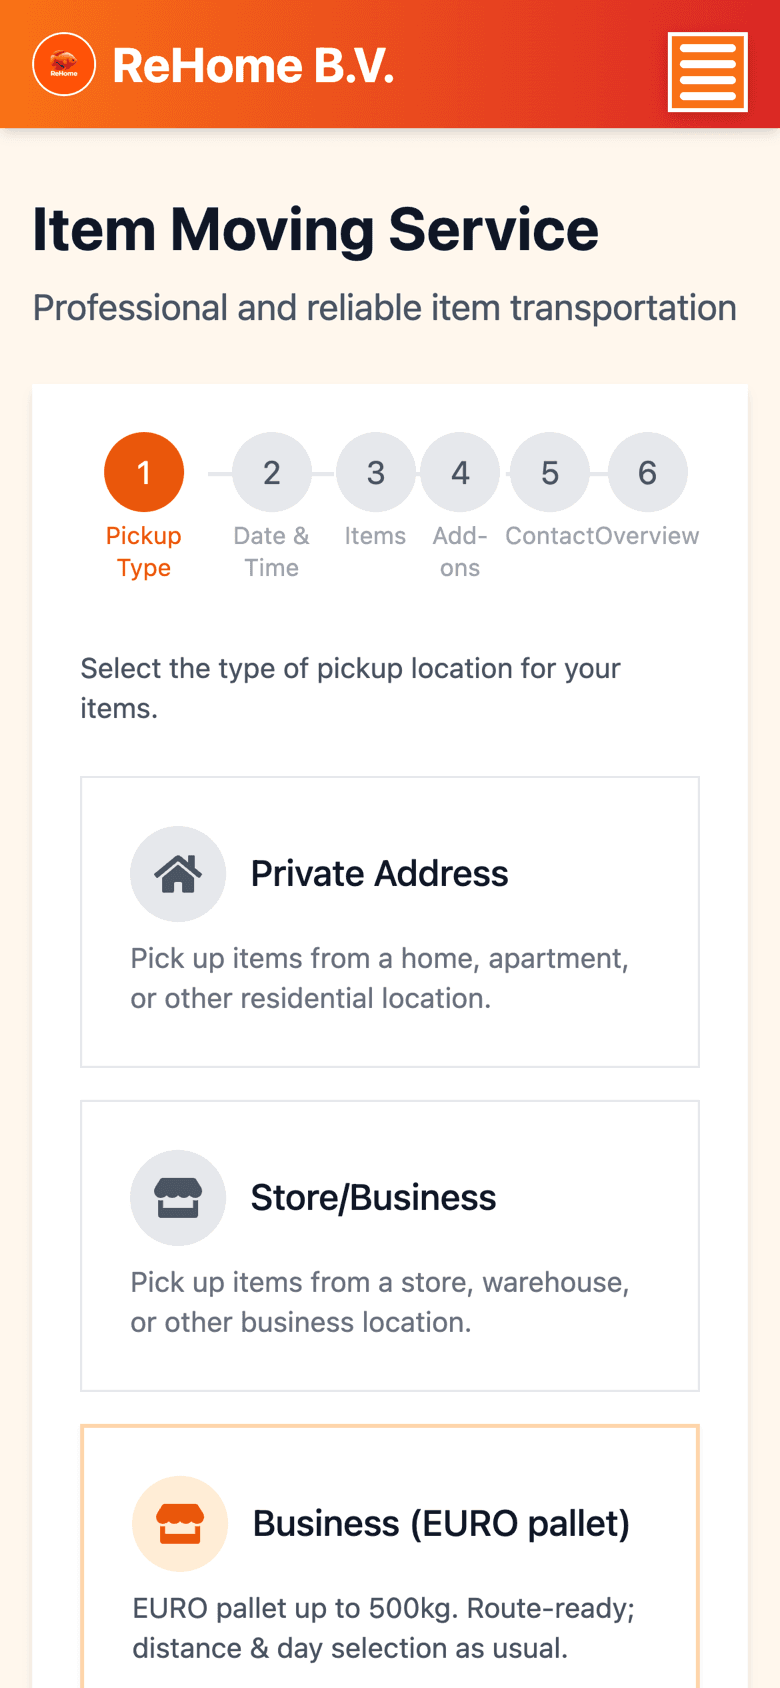
The phone version was the other half of it. The old flow put six steps across a screen that fits three, so the step labels ran into each other, and each item card took most of the screen. Look at the two below at the same width.
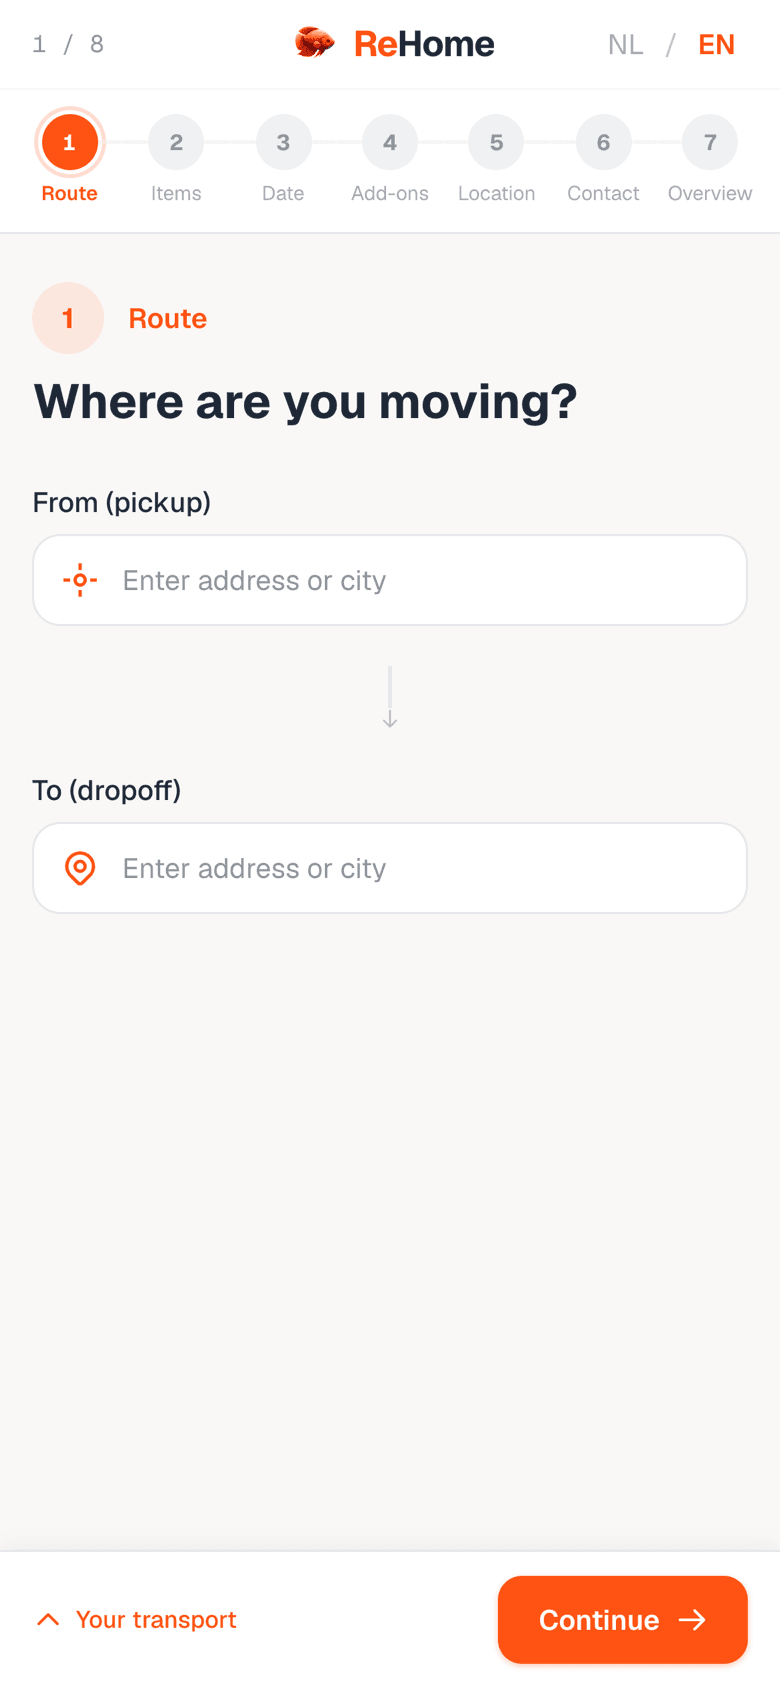
We rebuilt the pricing, rebuilt the flow around it, and tested the whole thing against real jobs before any of it went live.
The price on the screen is the price on the invoice. That should go without saying. It was not true before, and fixing it did more for their conversion rate than any design change we made.
Step 3. SEO
With the product working, the next question was how people find it. We put Rehome in front of the searches their customers were already typing, in Dutch and in English, across the whole country they serve.
It is worth being honest about the timeline. This is a young domain, and search is the slow half of the plan. Three months in it looks like this:
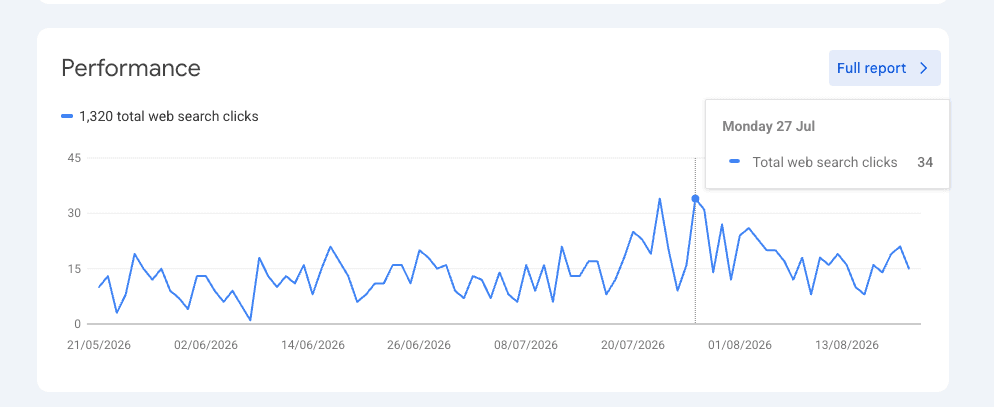
Those are small numbers next to the ad results below, and that is fine. Organic keeps working after you stop paying for it, so it is the half that compounds.
Step 4. Turn on Meta ads
While search built up, they needed something faster. Once the calculator was reliable, we had somewhere worth sending paid traffic, so we started on Facebook and Instagram.
It has done 136,714 impressions across 36,824 people at €14.54 per lead.
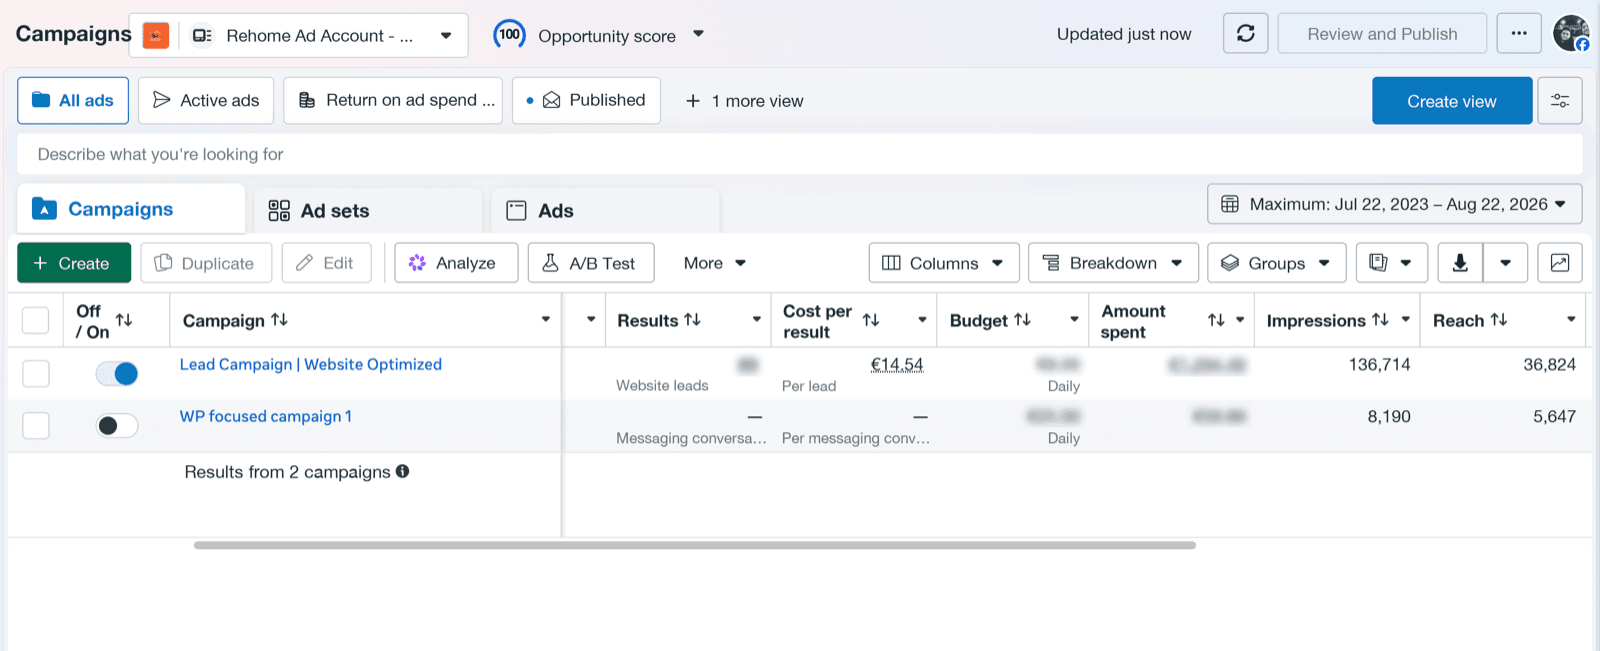
Their average job is around €150. Against €14.54 to generate the lead, that is roughly ten euros back for every euro in. We quote it as about 10x rather than a precise figure, because €14.54 buys a lead and not every lead becomes a booking. Even discounted heavily it is a channel worth feeding.
Where the customers come from now
The clearest picture of what changed is not traffic, it is the mix. For the first three months every customer arrived the way they always had. Then SEO and Meta start showing up, and the whole bar gets taller rather than just changing colour, which is the part that matters. The new channels added customers instead of relabelling the existing ones.
Across the six months revenue is up 193%. Not traffic, not leads. Revenue.
We are still working with Rehome. The calculator gets checked against real jobs, search keeps growing and the ads keep getting tuned. The 193% is where it stands today, not where it stops.
rehomebv.comThe live site. Try the calculator on your phone, which is the whole point.Could this work for your business?
Send us your site and the searches you want to win. You will get an honest read on whether the numbers above are repeatable in your market.